
How we adapted Yandex Metrics Ecommerce Model for Smart TV
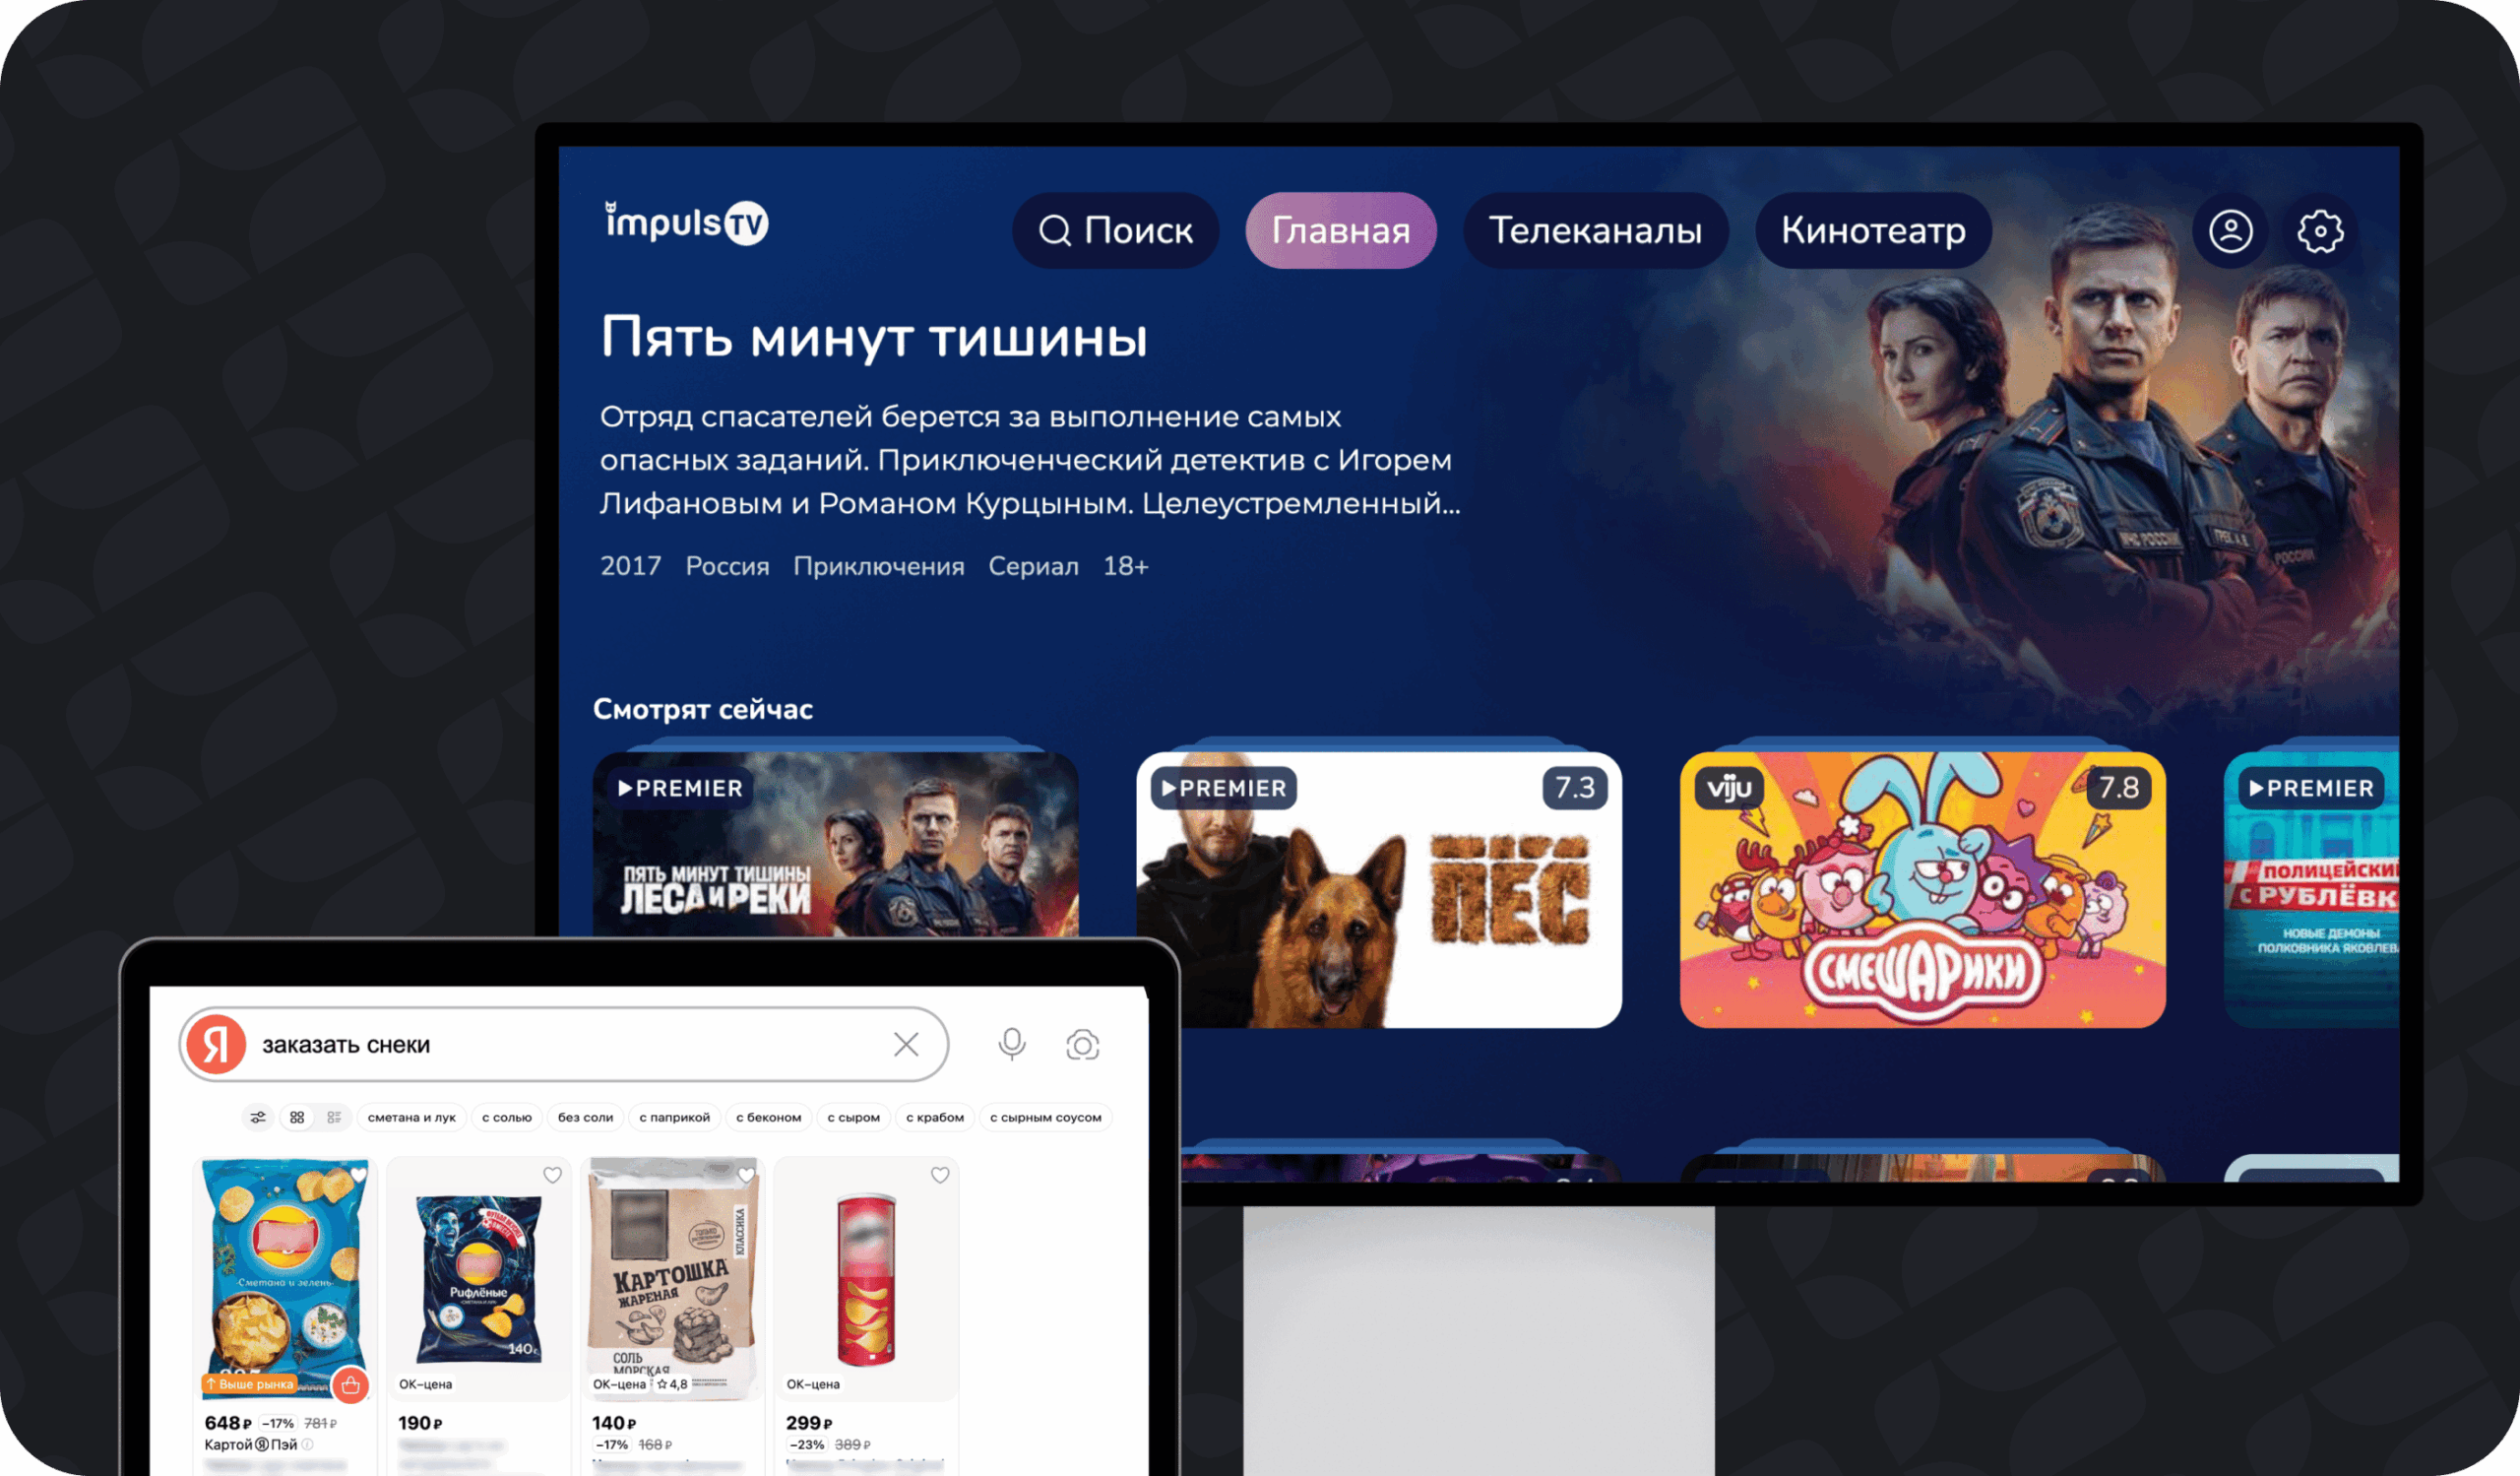
In the Smart TV application, the user does not put goods in the basket. He selects the film, opens the card of the series, switches between TV channels and launches the viewing.
At the same time, from the point of view of product analytics, its path is in many ways similar to the behavior of a buyer in an online store. The video service also has showcases, categories, individual products and targeted actions. Only instead of clothes and electronics – movies, TV series and TV channels, and instead of receiving an order – start watching or subscribe.
This analogy allowed us not to create a new analytical model from scratch. We adapted the Yandex Metrics Ecommerce model for video content and got a unified approach to analyzing the user path on LG webOS, Samsung Tizen and Android TV.
Why Web Analytics is Good for Smart TV
At the heart of our Smart TV applications is a single web application that runs inside shells for different TV platforms.
For the user, this is a regular application adapted for the large screen and control from the remote. But the interface, navigation, and basic product logic are all in common.
As a result, we do not need to implement analytics for each operating system. The counter and events are connected in the general part of the application, after which the data is collected according to uniform rules on different TVs.
However, simply installing a meter is not enough. It is necessary to determine which states of the application are considered separate pages, how to fix the selection of content, what parameters to transmit with events and how to distinguish the opening of the card from the actual start of the view.
Application screens as virtual pages
Our Smart TV application works like an SPA: when switching between sections, a new HTML page does not load fully.
Therefore, every significant state of the interface is treated as a virtual page. Separate pages become:
- main screen;
- list of tv channels;
- search results;
- a film or series card;
- tariff screen;
- other important sections of the application.
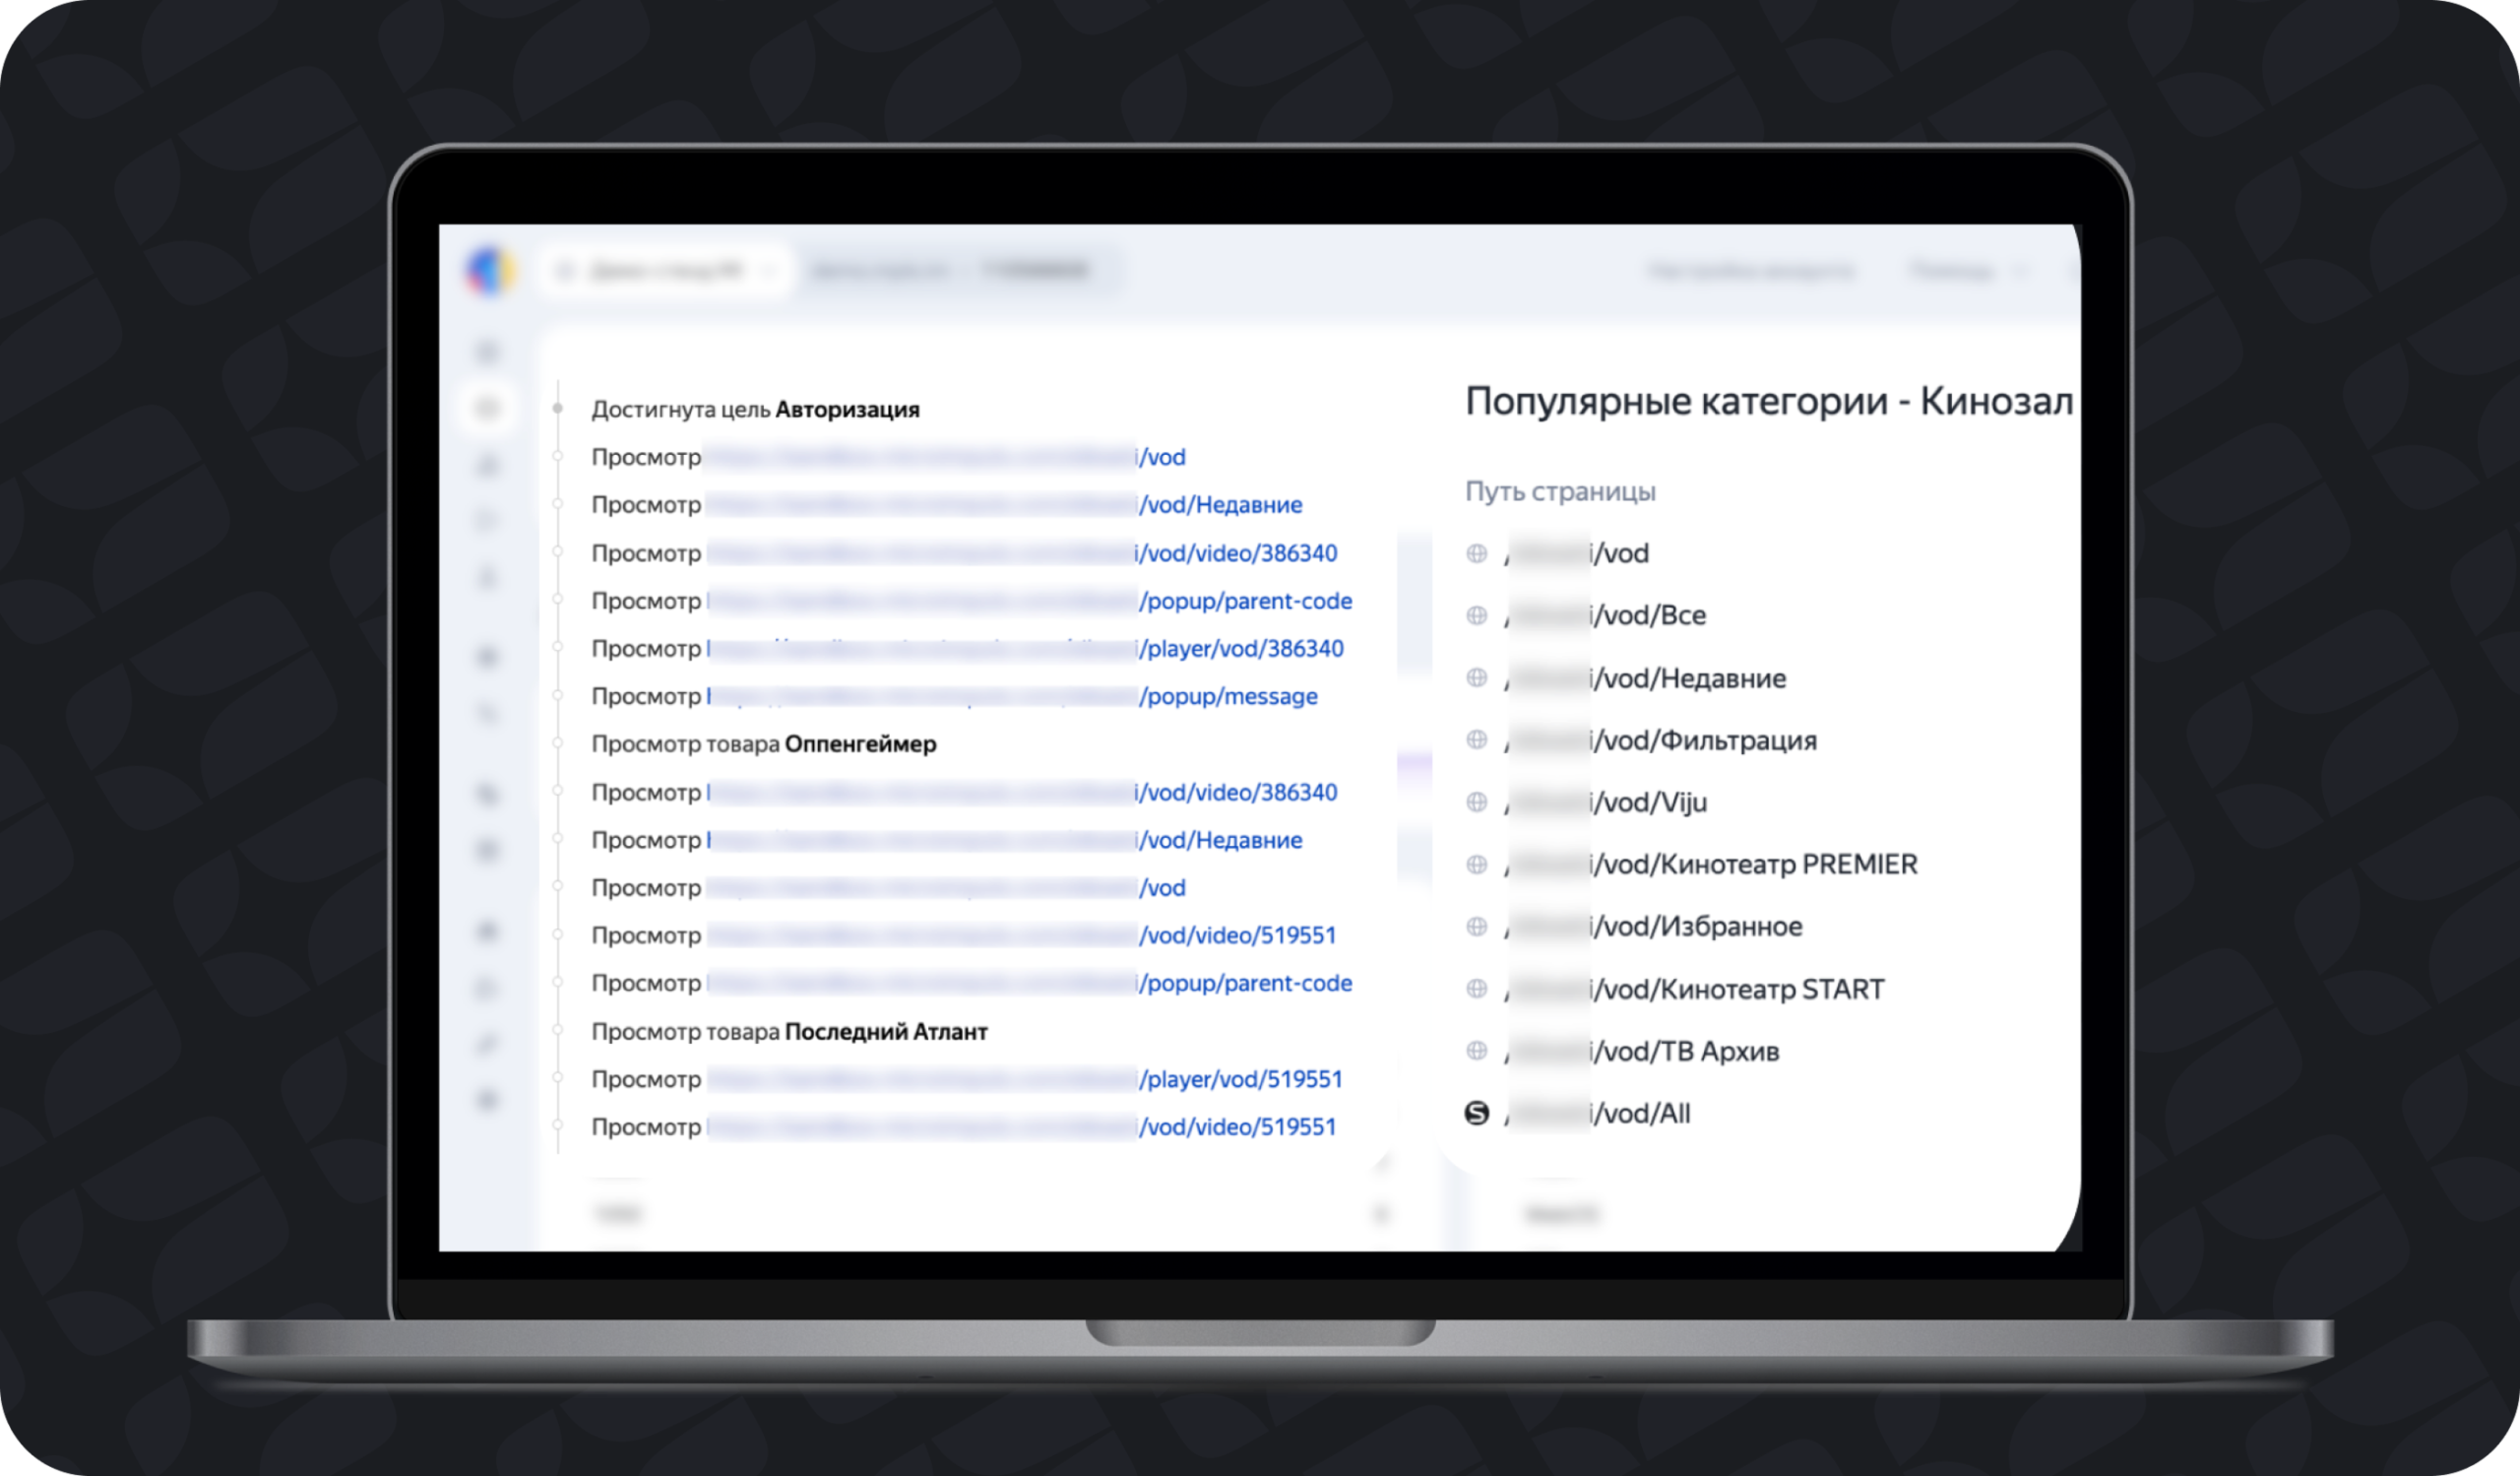
When you move between them, a new virtual view is sent to Metrica.
This structure allows you to analyze the popularity of sections, entry and exit points, the depth of transitions and routes before the target action. For example, you can see which screens a user goes through from launching an app to first browsing.
The virtual page can also include the name of the interface template. This allows you to compare different visual themes and variants of the main screen within the same analytical model, as well as run A/B testing of different features.
How Ecommerce Model Works with Video Content
The usual list of events like “opened the movie”, “pushed the button” or “launched the player” is enough only at the initial stage. As the product progresses, the number of events grows, and for each new report, you have to rethink their names and parameters.
The ecommerce model defines a single data structure for all content:
| Ecommerce | Smart TV app |
| Goods | Film, TV series, TV channel or TV program |
| List of goods | Selection, category, search, favorites or transmission program |
| Brand | Content Provider or Online Cinema |
| Category | Content type, category or genre |
| Click on the product | The user selected the content |
| View of goods | Content launched in the player |
| Addition to the basket | The user switched to the choice of tariff |
| Purchase | Subscription successfully completed |
One model applies to both movies and TV channels.
For example, for a film, the film itself becomes a commodity, and the source of choice is the Popular selection, genre, search or online cinema page. For the channel, the channel becomes a commodity, and the source is the general list, selected, thematic category or program of programs.
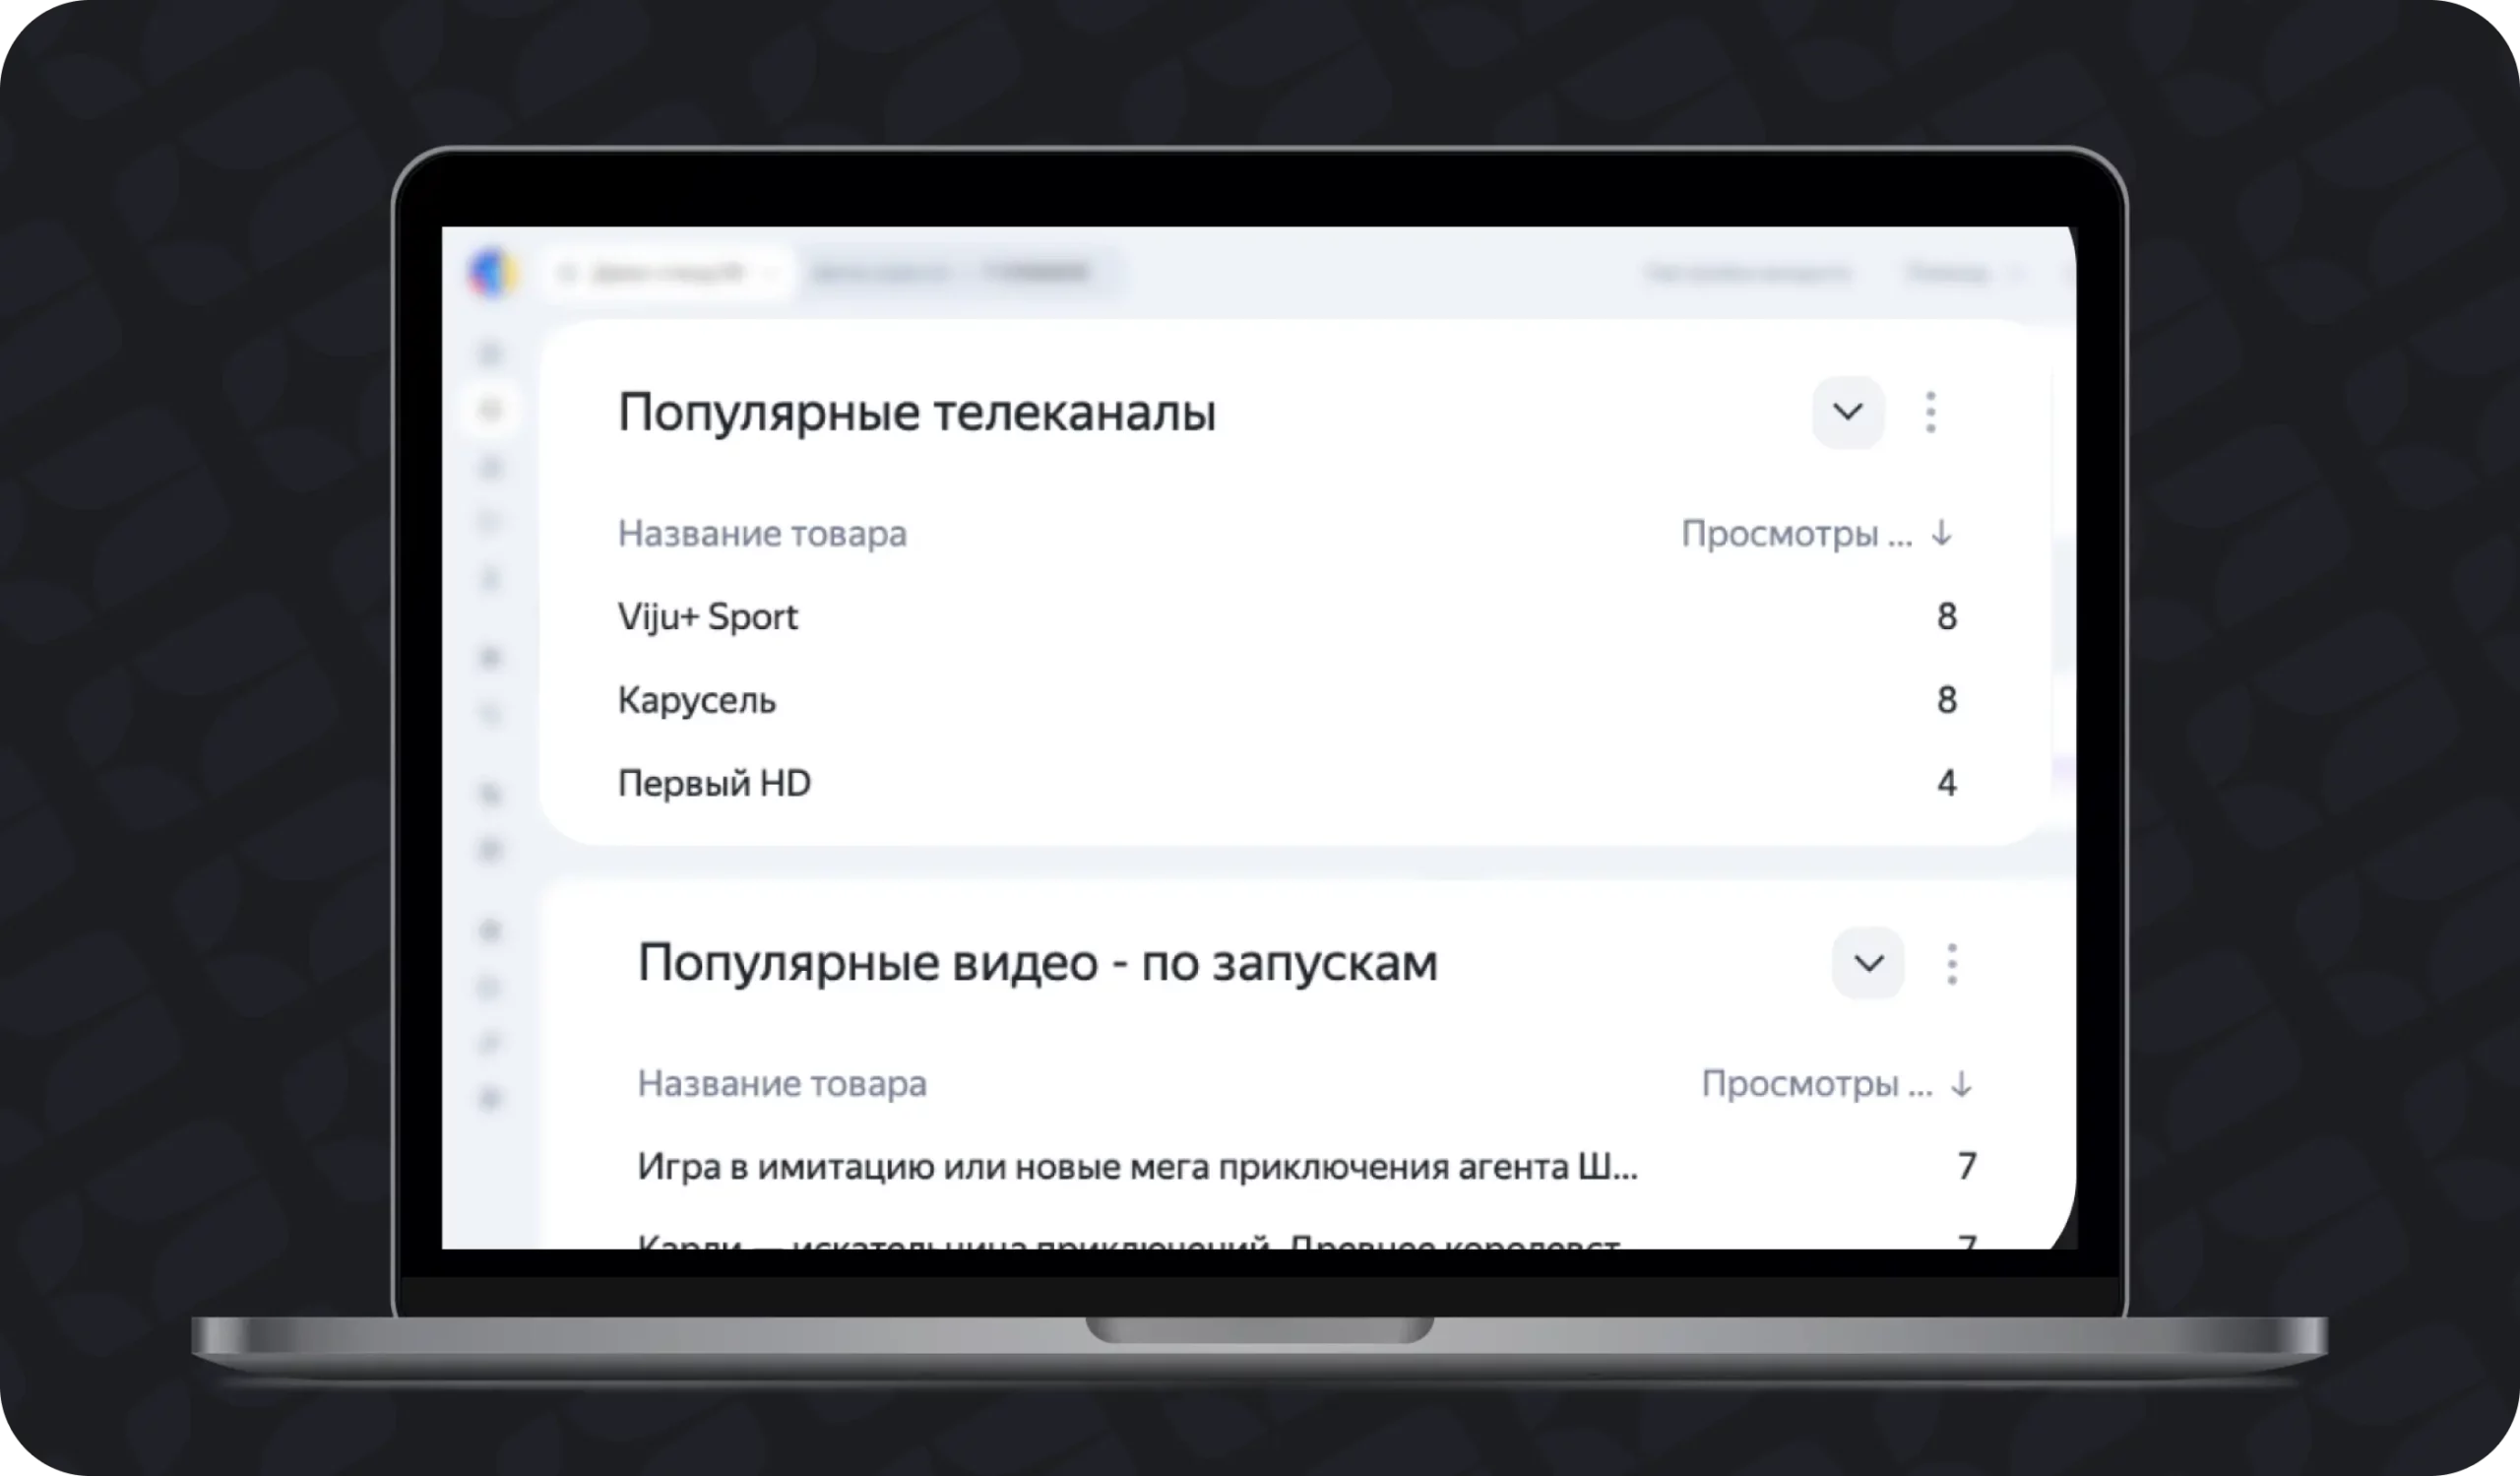
Along with the content, a selection and category of content are retained. So we see not only what the user started, but where they came from.
This allows you to compare different user paths:
- select the film on the main page and start viewing;
- launch of the channel from the general list or selected;
- moving from search to content card;
- transition from film card to tariff choice;
- subscription after interacting with a specific storefront.
As a result, the standard Ecommerce model turns into a tool for analyzing content storefronts and navigation inside a Smart TV application.
Selected significant events of the application
Not all user actions are convenient to describe through Ecommerce. Therefore, in parallel, we record individual product and technical events.
These include:
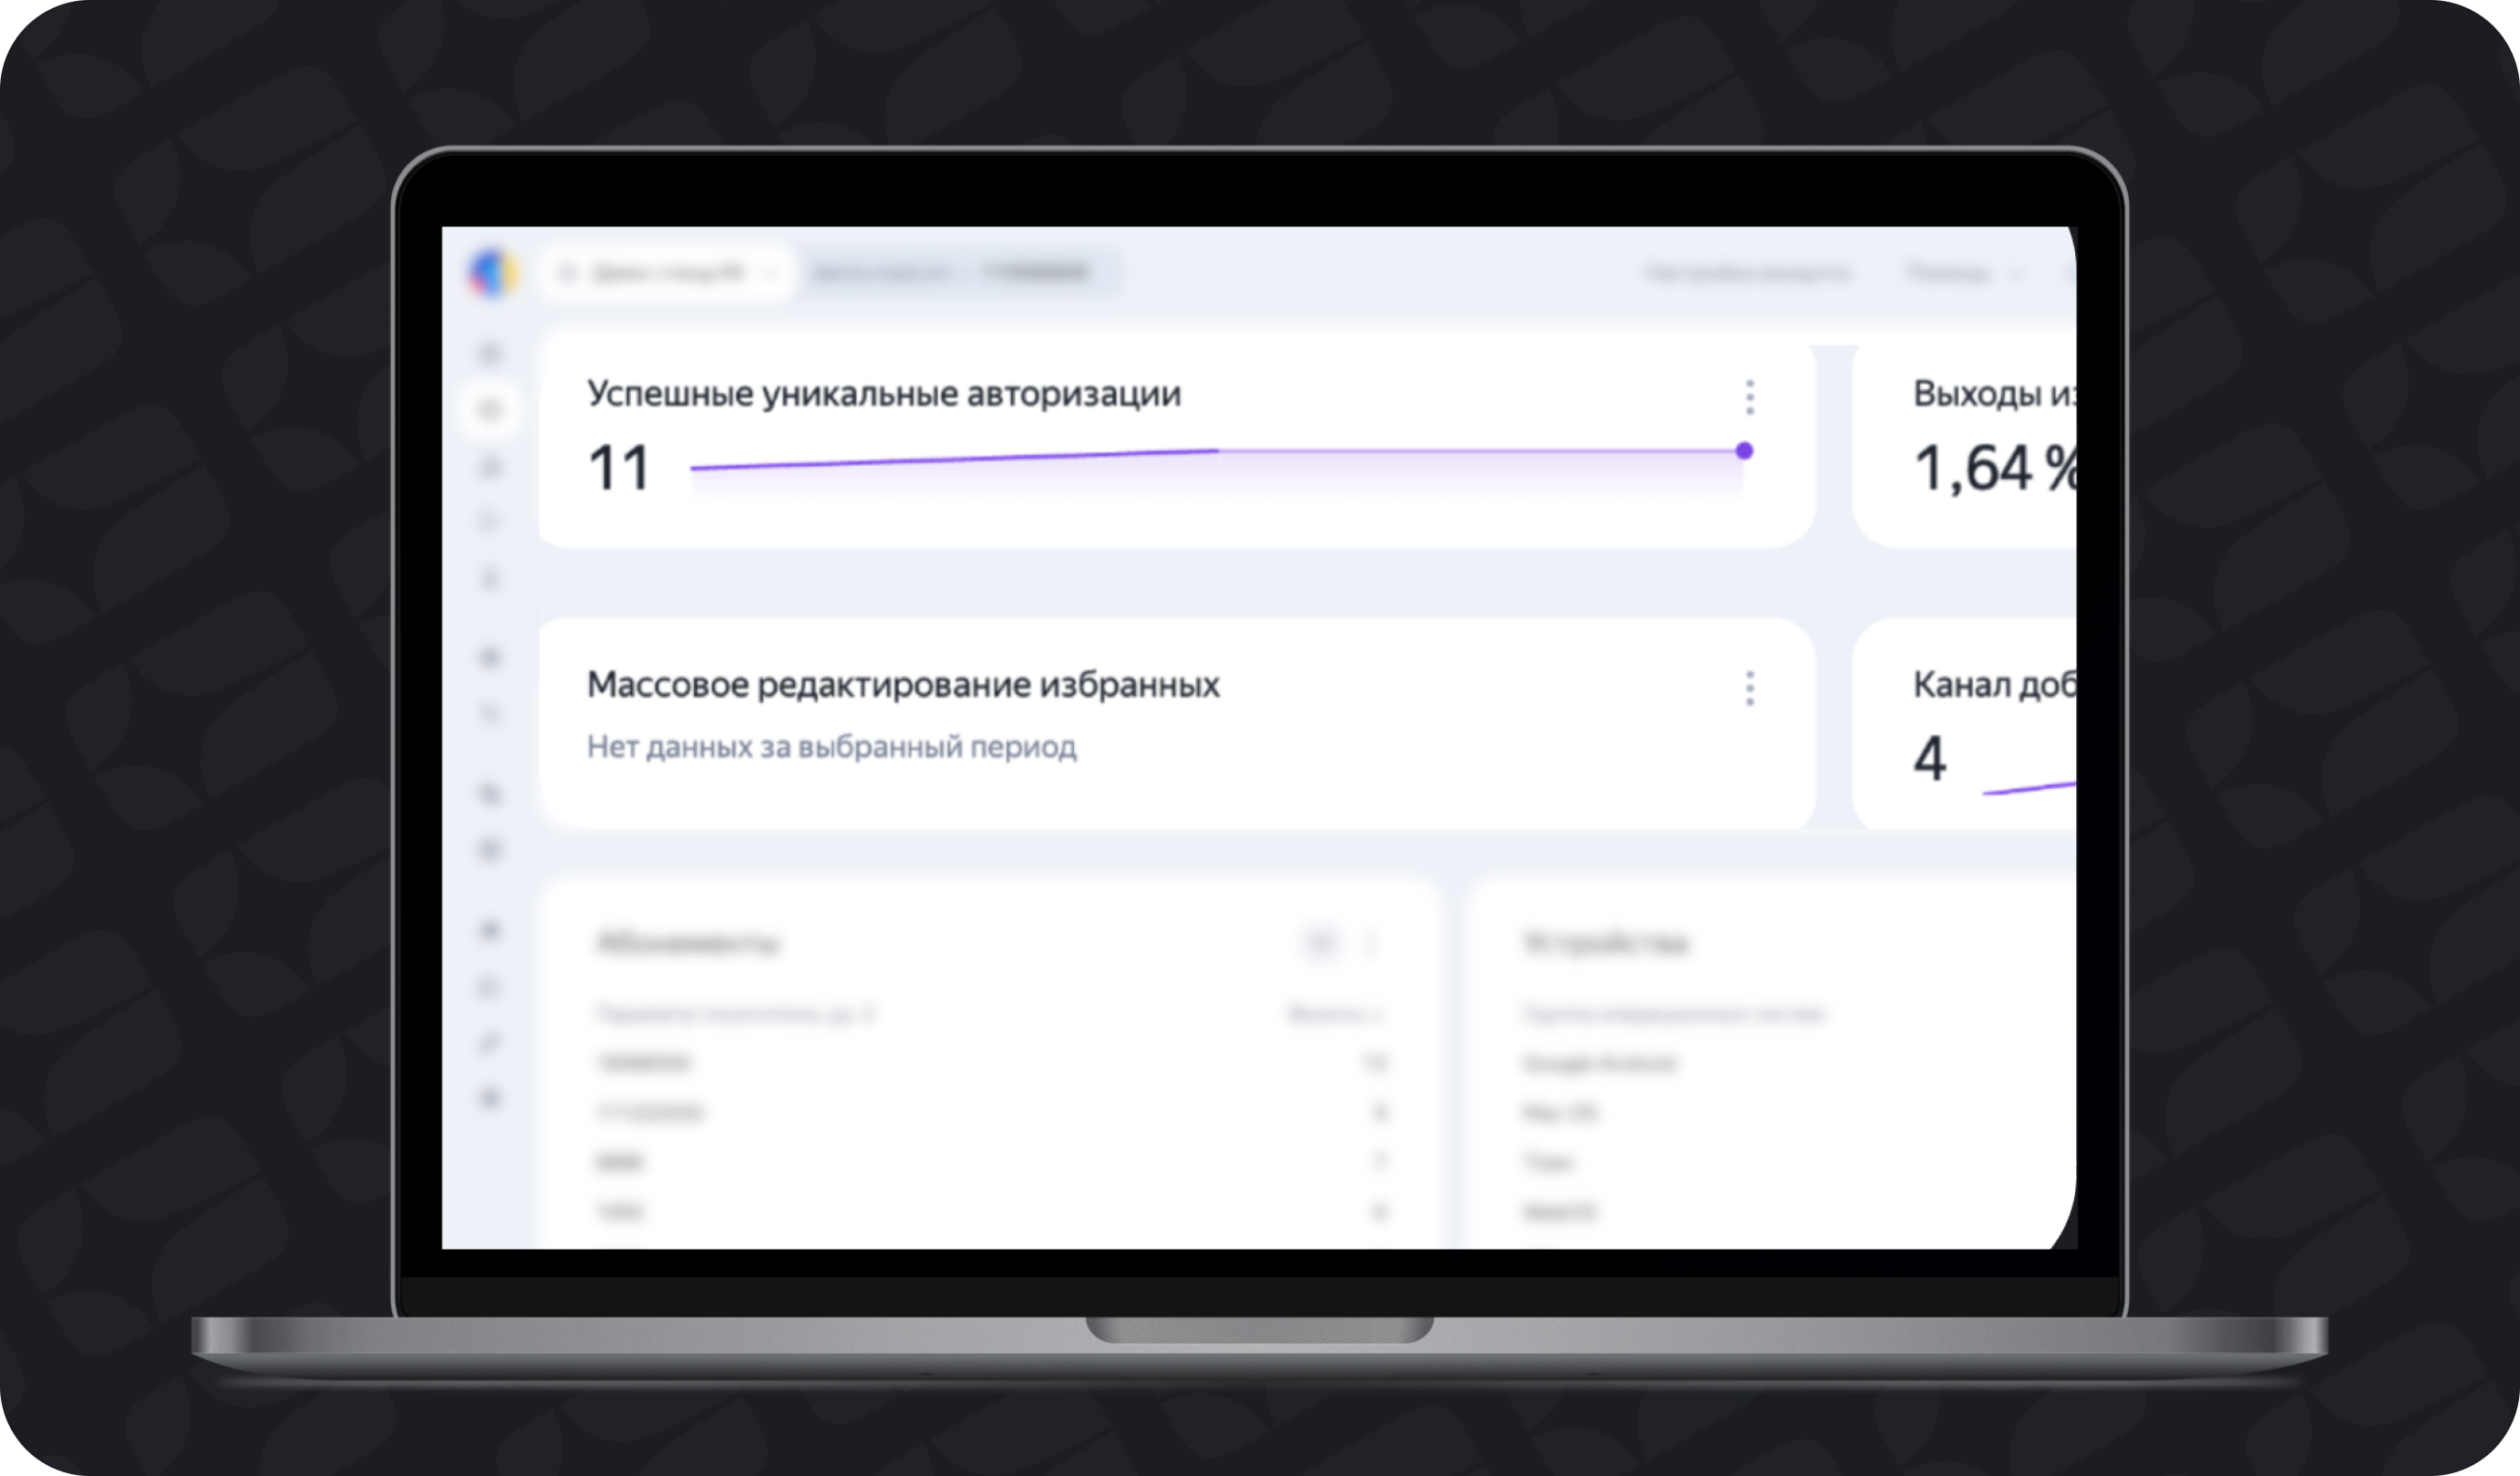
- successful authorization;
- exit of the user from the account;
- addition to the selected;
- changing the settings of the application;
Significant events can be set up in Metric as targets. This allows you to assess not only the number of convrsions, but also their effect on food funnels.
Technical and product parameters can be transmitted along with events:
- platform and device model;
- version of the application;
- the interface template used;
- authorization status;
- an impersonal account id;
- other features required for segmentation.
Personal data – telephone, email, address and other identifying information – are not transferred to the Metric.
An anonymous identifier allows you to combine the actions of one account on several devices and analyze the path of the user after authorization. Without it, different TVs of the same subscriber would be perceived as independent users.
What questions can be solved through analytics
After connecting, you can analyze not individual clicks, but full-fledged user scenarios:
- from which collections films are most often launched;
- from which screens users go to view;
- how does the launch of tv channels from the general list and category differ;
- what errors prevent you from viewing;
- how different interface options affect the passage of the funnel;
- what windows lead the user to subscribe.
Analytics helps move from a general understanding of content popularity to an assessment of the effectiveness of specific interface elements.
For example, a movie can have a large number of launches, but that doesn’t mean that every collection it’s presented in works well. Saving the source of choice allows you to determine which storefront leads the user to view.
Why Yandex Metrica does not replace MiStats
Yandex Metrica and our own system they solve different problems.
The metric shows the user’s path within the interface: screens, selections, content selection, authorization, errors and transitions to targeted actions.
MiStats records the actual consumption of content, including the duration of viewing. This allows you to distinguish the fact of the launch from the actual involvement of the user.
In the future, MiStats data can also be associated with subscriber billing events. In addition, its own system provides data collection on devices where connecting an external meter is impossible or requires separate adaptation.
Thus, Yandex Metrica helps to analyze the interface and user scenarios, and MiStats complements it with real browsing data.
How to connect analytics
To discuss connecting analytics to your project, contact your manager. We will demonstrate the solution and help you identify the scenarios that will be most useful to your team.
